 All Case Studies










What a Good Marketing Report Shows About Leads and ROI
October 20, 2026 | 7 min read

Rahul Yadav
Founder and CEO at Dcrayon

A good monthly marketing report shows what you spent, how many leads arrived, how many of them were qualified, what each qualified lead cost, and how your search visibility moved. It names the source of every figure, says plainly what attribution cannot prove, and leaves out numbers that will not change a decision.
The report is where marketing claims meet your accounts. This guide sets out the report we think every pay-per-click advertising or search engine optimization client should expect, section by section. If you are still choosing a partner, our guide on how to compare digital marketing agencies explains how to ask for a sample report before you sign.
What should a monthly digital marketing report contain?
A one-page summary first, then one section for each question you are paying to answer.
- Spend: by channel and campaign, against the plan for the month.
- Leads: every form, call and chat the tracking recorded.
- Qualified leads: the leads your sales team accepted, counted on their own line.
- Cost per qualified lead: spend divided by qualified leads, for each channel.
- Revenue: sales the data can tie to marketing, with the attribution model named.
- Search visibility: clicks, impressions, and the queries and pages that moved.
- Work log: what was changed, published or paused, with dates.
- Next month: the two or three changes planned, and the reason for each.
Every number should carry its source, such as Google Ads, Google Analytics 4, Search Console, Amazon Seller Central or your CRM. A figure with no source is one you cannot check for yourself.
Why should leads and qualified leads be counted separately?
Because a cheap lead that never buys costs more than it looks, and only a separate count shows it.
A lead is an enquiry. A qualified lead is one your team agrees is worth following up, judged against rules you set together, such as the right city, a real budget or a product you actually sell. Google Ads now makes the same split: its qualified leads and converted leads goals track leads that were further qualified in your CRM, and its lead funnel report runs from interactions to leads, qualified leads and converted leads.
On the website side, Google Analytics 4 lets you mark any event as a key event, for example a form submission, a call click or a purchase. Agree in writing which events count, then keep that list fixed so one month compares cleanly with the next. Our guide on how to set up GA4 properly covers the setup work.
How do you work out cost per qualified lead?
Divide a channel's spend for the month by the qualified leads that channel produced in the same month.
Three choices keep this figure honest:
- Decide whether the agency fee sits inside the cost or beside it, and never switch midway.
- Allow for lag. A lead from the last week of a month may be qualified in the next, so restate the earlier month once the CRM catches up.
- Show it per channel and per campaign, not only as one blended number.
This is also the figure that tells you whether growth is getting cheaper. If spend rises and qualified leads rise faster, cost per qualified lead falls. If both rise at the same pace, you are buying more volume at the same price. Channels that do not charge per click, such as organic search and content, can add qualified leads without adding media spend, although they carry production costs and take longer to build. For the standard ROI, CPA and conversion rate formulas, see Is Your Performance Marketing Strategy Actually Working?
What can revenue attribution prove, and what can it not?
Attribution shares out credit for a sale across the clicks before it. It does not prove that any one channel caused the sale.
Google Analytics 4 offers three attribution models: data-driven, paid and organic last click, and Google paid channels last click. Google notes that no model gives credit to direct visits unless the whole path was direct, and that the first click, linear, time decay and position-based models were retired in November 2023. A sound report names the model it used and keeps using it.
Three limits belong in writing:
- Each ad platform counts its own conversions, so adding the Google Ads, Meta and Amazon totals together can count one sale more than once.
- Sales made by phone, on WhatsApp or in a shop do not appear unless you import them from your own records.
- A change to tracking or consent settings can move the numbers with no change in real demand.
Keeping measures apart helps as well. On Keratine Professional's Amazon India account, we record Best Sellers Rank, organic keyword position and sponsored placement in separate columns, because each one measures something different, as our Keratine Professional case study explains. That case study also says its sales figures are not published, and a report should be just as open about what it leaves out.
How should search visibility appear in the report?
Use Search Console figures broken down by query and by page, rather than a single ranking chart.
The Search Console Performance report gives four core measures: clicks, impressions, click-through rate and average position. A useful search section shows:
- Clicks and impressions for brand and non-brand queries, kept apart.
- The pages that gained or lost clicks, next to the work done on them that month.
- New queries that began sending clicks.
The work log matters as much as the chart. Our Cartense case study makes the point: when search work, creator posts and short YouTube videos ran in parallel from February to April 2026, a dated record of what went out, and where, was what made each channel possible to judge. On Glowral's store, Search Console verification and a Google Analytics 4 tag through Google Tag Manager were in place while the blog grew, so the team could see which shopper questions were bringing visitors in.
What should a marketing report leave out?
Anything that will not change a decision this month can move to an appendix.
- Impressions and reach with no clicks, leads or sales beside them.
- Follower counts shown on their own.
- One average position for the whole site, which blends every query into a single figure.
- Conversion totals added up across platforms that each claim the same sale.
- Counts of "ranked keywords" that include terms no buyer types.
- Screenshots with no date range.
None of these are false. They simply do not answer the questions you are paying to have answered.
How can a report help you scale without raising costs much?
By showing where to move budget, not only how much was spent.
Once cost per qualified lead is broken down by campaign, the next step is usually clear: shift budget towards the campaigns with the lowest cost at steady lead quality, and cut the search terms that bring enquiries your team turns away. Campaign structure is what makes that split visible. For Keratine Professional's best-selling combo, Sponsored Products were rebuilt in March 2026 as separate automatic, broad-match and exact-match campaigns, so the numbers could show which kind of search produced orders, with negative keywords stopping the brand's own combos from bidding against each other.
Clients notice this in how the work runs as much as in the figures. In a Clutch review, Nirwana Jewellers' chief executive linked our work to higher social media engagement, more website traffic and sales targets met during festive periods, and wrote that the team "demonstrated excellent project management throughout our engagement." If tracking is the part you want to fix first, our analytics and insights service covers conversion tracking and dashboards, and our Amazon account management service applies the same column-by-column reporting to marketplace accounts.
Check our reviews
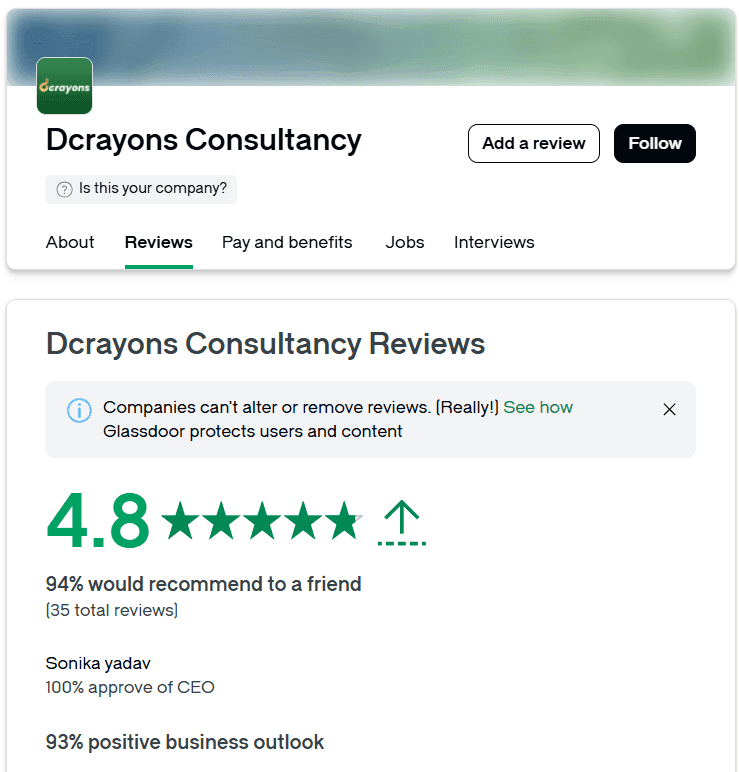
Read what our marketing clients say before you read any report from us. Glowral and Nirwana Jewellers reviewed our work on Clutch, where we hold 4.9 from 7 reviews, and Skippy Sports, a badminton retailer, reviewed us on GoodFirms, where we hold 4.9 from 8 verified reviews. Both figures are as of October 2026.
Questions buyers ask
How often should a marketing report arrive?
Monthly suits the full report, with shorter updates in between for busy ad accounts. Fix the day it arrives and the period it covers, so every month compares cleanly.
Who should own the Google Ads, GA4 and Search Console accounts?
Your business. Add the agency as a user on accounts you own, so the history stays with you if you ever change partners.
Can a report prove ROI?
It can show the return on spend for the sales your tracking captures. It cannot prove a sale would not have happened anyway, so treat attribution as strong evidence rather than proof.
What if leads rise but qualified leads fall?
Check the search terms and audiences behind the new leads, look for form spam, and confirm the qualification rules have not changed. Then move spend away from the sources your team keeps rejecting.
Related Articles
More insights from the Dcrayon desk.

Tesla’s Flying Roadster Stunt How Bold Brand Stunts and Marketing Capture Attention in the Age of Social Media
Meta description: Explore how Tesla’s Flying Roadster stunt highlights viral marketing, bold brand positioning, creative campaigns, and social media engagement.

High-Converting Business Websites: What Service Firms Need
What makes a service or B2B website produce enquiries: one page per service, proof beside the form, short forms that ask the right question, and fast pages.

Luxury Brand Website Redesign Without Losing Traffic
How to redesign a premium or luxury brand website and keep search traffic and sales: URL inventory, redirects, photography, type, speed and checkout trust.
Want to grow your digital presence?
Let's discuss how we can help your business.