

Version-controlled metric logic
Every metric and dashboard change ships in Git: a definition diff, before and after query results, a data dictionary entry, and a note in the docs site.
Two recent business intelligence engagements built on one governed semantic model. Full metrics under MNDA; workbook walkthrough on a scoping call.

Cloud and Data engagement,
BI and analytics lead
Dcrayon replaced our tangle of exported spreadsheets with one governed Power BI model. Every dashboard now traces to a defined measure that finance signs off on.
Microsoft Power BI cost and monthly active viewers
Manual reporting hours cut each week
Business intelligence build: star-schema warehouse, dbt-modeled measures, and a certified Tableau workbook with row-level security. Definitions live in a shared data dictionary.
Read Cloud and Data engagement's Case Study
Mid-market cloud and data brand,
BI and data warehouse lead
Our dashboards contradicted each other for more than a year. Dcrayon rebuilt the semantic layer so sales, finance, and operations read the same revenue figure.
Duplicate reports consolidated, shown on scoping call
Dashboard refresh latency reduced
Business intelligence build paired with a cloud warehouse migration. A free Dcrayon Score readout mapped every existing report to its true source before cutover.
Read Mid-market cloud and data brand's Case StudyHOW DCRAYON BUSINESS INTELLIGENCE WORKS

What ships by default on every Dcrayon business intelligence engagement
Every metric and dashboard change ships in Git: a definition diff, before and after query results, a data dictionary entry, and a note in the docs site.

Dcrayon AI watches your key metrics for anomalies, flags dashboard drift, and writes plain-English summaries of what moved and why.

We right-size Power BI Premium capacity and Tableau seats and cut warehouse spend by pruning heavy queries.
You see cost per active dashboard user, not just a licence bill.

Row-level security, certified datasets, and access roles are set from the start, with SOC 2, ISO 27001, and GDPR-aware controls applied to every report.
Score, Sequence, Repair. The analytics maturity diagnostic, the quarter-long roadmap, and the AI-assisted toolkit we run on every business intelligence engagement.

A 150-point read across your data stack. The business intelligence layer scores your warehouse model, your semantic layer, refresh reliability, DAX and measure hygiene, and how many people actually open the dashboards. Free on every proposal call.
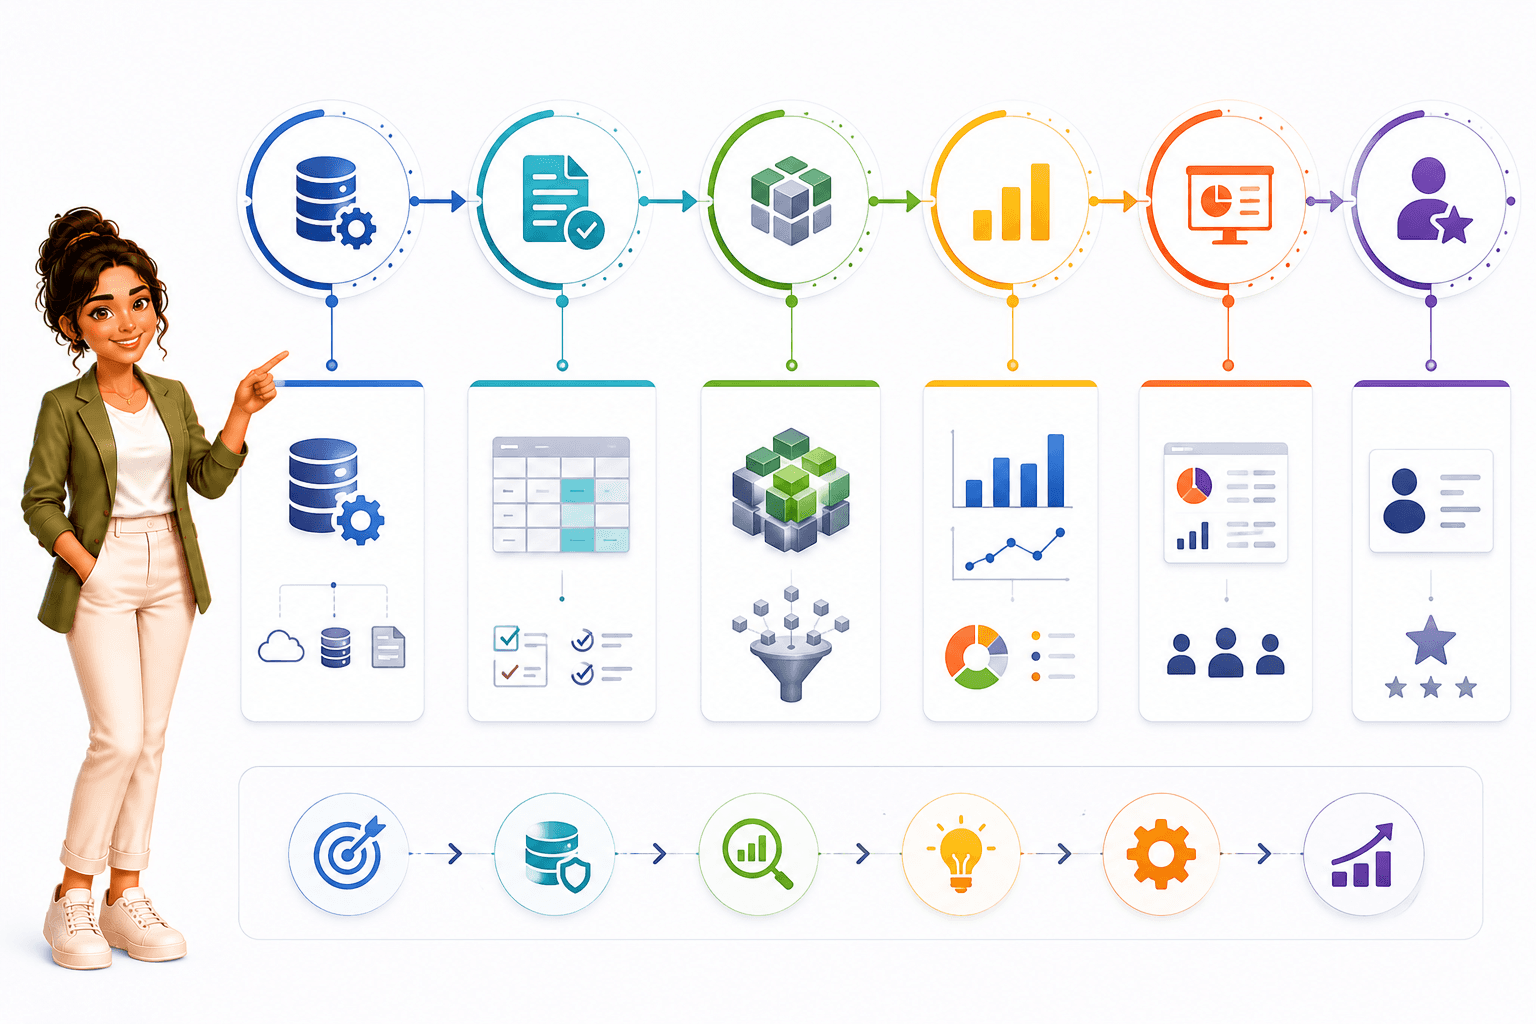
The roadmap that sequences your business intelligence work back to one reporting metric you pick, from data model to a dashboard people open every morning.

Internal toolkit that audits your dbt models and dashboards, finds broken or duplicated metrics, and writes a prioritized fix list finance can budget.
Three repeatable practices that make each reporting cycle build on the last.
A free Dcrayon Score readout. We rate your reporting setup from 0 to 100, checking whether the numbers reconcile across Power BI, Tableau, and your finance exports, and hand you the list of gaps. No follow-on commitment.
A written 90-day plan built around one operational metric you name, like on-time delivery or gross margin. A senior BI engineer designs the data model and each report. Either side can end the SoW at day 90; no annual lock-in.
A weekly working call plus a monthly summary your finance team can read. The work stacks: a clean data model in the first cycle earns the dashboards people trust in the second, which support the alerts and scheduled reports in the third.
Sibling Dcrayon services inside the Cloud and Data category. Programs clients often layer alongside Business Intelligence.

No juniors learning DAX or LookML on your budget. The architect who models your data stays on the account.

A written diagnostic and fixed estimate up front. You see exactly which reports and models we would fix before you sign anything.

Every engagement includes AI-assisted analytics: anomaly alerts on key metrics, forecast lines on trends, and natural-language querying where your tools support it.

Weekly sessions and a monthly readout tied to one reporting metric. Numbers finance can read without an analyst translating them.



Across our 60+ active solutions retainers, the median 12-month cost we measure for teams still running the business on manual spreadsheet reports lands in the Rs 6L to Rs 90L band. Book the scoping call to size yours.
Free five-axis Dcrayon Score on your BI and reporting stack
Written plan tied to one reporting metric you pick

We start with the free Score readout, then scope a plan you approve before any build begins. Once the SoW is signed, we move into data modeling and semantic-layer work.
Both. Some clients use us as their full analytics team; others use us as the BI architect and escalation layer for an in-house data team. We scope per account.
Most business intelligence engagements start at Rs 4 to 8 lakhs per month (India) or USD 6 to 15 thousand per month (global). That covers the data model, the Power BI or Tableau build, and the reporting. Audit-only engagements start lower.
Yes. A free five-axis Score readout on your reporting stack on every proposal call. No follow-on commitment required.